Quick search…
Tutorials
Data integration
Tutorials and guides
Dashboards Guide
Dashboards are great for monitoring your key performance indicators (KPIs) and conducting vital data analyses within a consistent interface.
You can access your favorite dashboards from the Home screen, or see the complete list under "Dashboards" in the sidepanel navigation.
Creating a new dashboard
To create a new dashboard go to the Dashboard list by clicking "Dashboards" on the sidepanel navigation, and then click "Create Dashboard" in the top right. Once you have entered a name your new dashboard will be created.
Adding charts
Click "Add Chart" to add a new chart to a dashboard. You can also save a chart from the "Chart Builder" directly.
Editing your dashboards
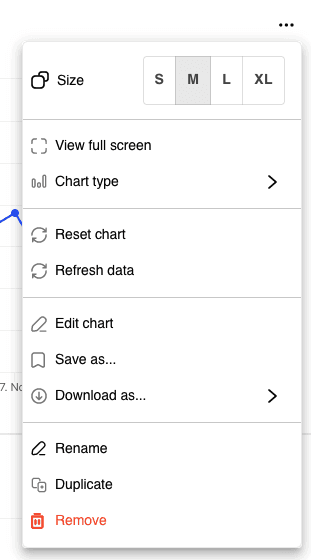
Each widget has a "three dot" menu at the top right. Clicking this will open a menu containing the following options:
Navigating your dashboard
You can use the "Filter by date" feature to alter the timerange for all charts in the dashboard.
If you want to update the data on the page, use the "Refresh" option at the top right.
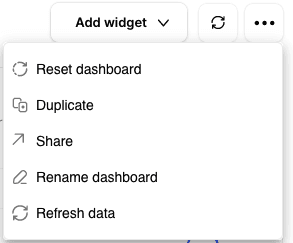
The three dot menu at the top of the dashboard contains some useful functions, such as being able to rename, share and duplicate a dashboard.
Zooming in on charts
Click and drag on a chart region to "zoom in" to that area.
Dashboards are great for monitoring your key performance indicators (KPIs) and conducting vital data analyses within a consistent interface.
You can access your favorite dashboards from the Home screen, or see the complete list under "Dashboards" in the sidepanel navigation.
Creating a new dashboard
To create a new dashboard go to the Dashboard list by clicking "Dashboards" on the sidepanel navigation, and then click "Create Dashboard" in the top right. Once you have entered a name your new dashboard will be created.
Adding charts
Click "Add Chart" to add a new chart to a dashboard. You can also save a chart from the "Chart Builder" directly.
Editing your dashboards
Each widget has a "three dot" menu at the top right. Clicking this will open a menu containing the following options:
Navigating your dashboard
You can use the "Filter by date" feature to alter the timerange for all charts in the dashboard.
If you want to update the data on the page, use the "Refresh" option at the top right.
The three dot menu at the top of the dashboard contains some useful functions, such as being able to rename, share and duplicate a dashboard.
Zooming in on charts
Click and drag on a chart region to "zoom in" to that area.
Tutorials and guides
Dashboards Guide
Dashboards are great for monitoring your key performance indicators (KPIs) and conducting vital data analyses within a consistent interface.
You can access your favorite dashboards from the Home screen, or see the complete list under "Dashboards" in the sidepanel navigation.
Creating a new dashboard
To create a new dashboard go to the Dashboard list by clicking "Dashboards" on the sidepanel navigation, and then click "Create Dashboard" in the top right. Once you have entered a name your new dashboard will be created.
Adding charts
Click "Add Chart" to add a new chart to a dashboard. You can also save a chart from the "Chart Builder" directly.
Editing your dashboards
Each widget has a "three dot" menu at the top right. Clicking this will open a menu containing the following options:
Navigating your dashboard
You can use the "Filter by date" feature to alter the timerange for all charts in the dashboard.
If you want to update the data on the page, use the "Refresh" option at the top right.
The three dot menu at the top of the dashboard contains some useful functions, such as being able to rename, share and duplicate a dashboard.
Zooming in on charts
Click and drag on a chart region to "zoom in" to that area.